






CAREER
Your career.
Optimized.
Join Exodraft and our shared
ambition to build the bridge to a CO₂-neutral
future with greener energy for everyone.
How to Achieve Energy Savings in 2026?
As 2026 approaches, energy savings will depend less on dramatic promises and more on measured, repeatable actions. Homes, offices, and factories can reduce waste by understanding where energy disappears each day. A smart meter may reveal a heating system that runs during empty hours. A simple inspection may uncover damaged insulation around a warehouse door.
Reliable decisions begin with reliable evidence. Review twelve months of utility bills before choosing new equipment. Compare usage during similar weather conditions. Professional energy audits can identify inefficient boilers, poor ventilation, compressed-air leaks, and outdated lighting. These findings help owners invest in improvements with realistic payback periods. They also prevent attractive technology from becoming an expensive guess.
Small changes matter.
In 2026, efficient heat pumps, building controls, solar generation, and battery systems may support wider energy savings. However, performance depends on installation quality, maintenance, local climate, and user behavior. An efficient system cannot perform well when filters remain blocked or controls are poorly configured. That uncomfortable detail is often ignored.
This guide examines practical methods for reducing consumption without compromising safety, comfort, or productivity. It considers household routines, commercial buildings, industrial processes, and renewable energy options. Recommendations should be checked against current national standards and guidance from qualified professionals. Energy prices and available incentives can also change quickly.
There is no universal solution. A small apartment needs different priorities than a refrigerated warehouse. The strongest strategy is usually the one that combines accurate measurement, sensible upgrades, and regular review. Mistakes are possible. The important step is noticing them early, learning from the data, and improving the plan.
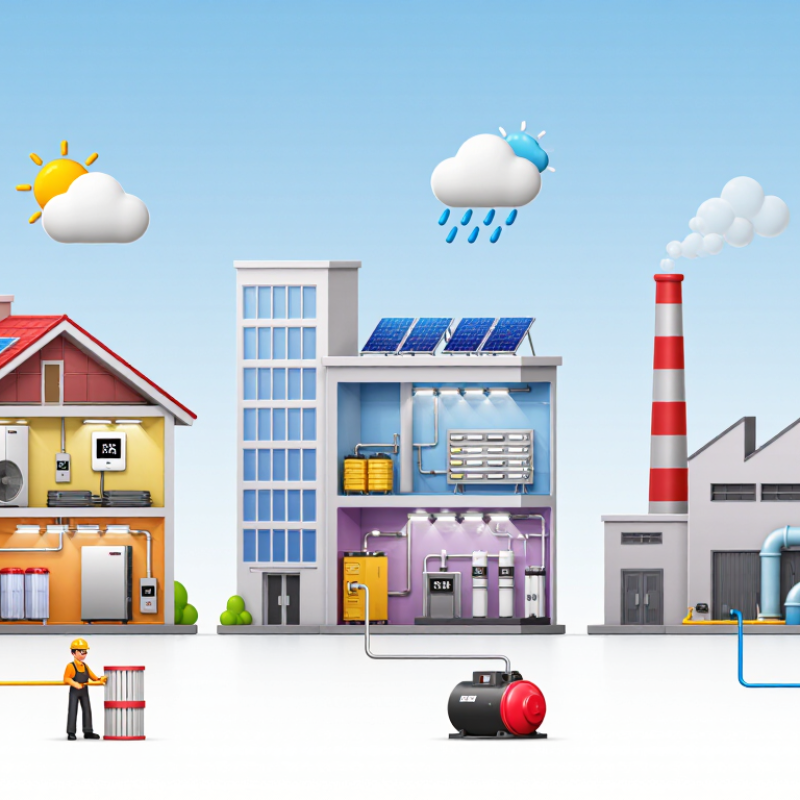
Establish a 2026 Baseline: Buildings Consume 30% of Global Energy (IEA)
How to Achieve Energy Savings in 2026?
The International Energy Agency reports that buildings consume about 30% of global energy. That figure makes every office, school, and apartment part of the climate equation. In 2026, building owners should establish a reliable energy baseline before purchasing new equipment. Record monthly electricity, heating, cooling, and water-heating use for at least twelve months. Include floor area, occupancy, weather, and operating hours. A simple spreadsheet can reveal unusual night-time consumption.
Begin with a walk-through audit. Check air leaks around doors, overheated rooms, blocked vents, and lights operating in empty spaces. Measure indoor temperatures at different times. A cold meeting room beside an overheated corridor often signals poor control, not insufficient equipment. Maintenance teams should inspect filters, valves, insulation, and control schedules. These details affect energy performance more than many people expect.
The first baseline may be imperfect. Meter errors, missing invoices, and changing occupancy can distort the comparison. Document those weaknesses instead of hiding them. Compare energy use per square metre and per occupant each month. Set practical targets, such as reducing after-hours electricity by 10% within one quarter. Train occupants to report open windows, faulty sensors, and unusual noise from mechanical systems. Small observations matter. Review the data every month, then adjust the plan when real building conditions challenge the original assumptions.
How to Achieve Energy Savings in 2026? — Establish a 2026 Baseline: Buildings Consume 30% of Global Energy
A practical baseline framework for measuring building energy performance, identifying savings opportunities, and tracking progress throughout 2026.
| Energy Dimension | Verified Baseline | Unit / Scope | 2026 Tracking Method | Suggested 2026 Benchmark | Primary Source |
|---|---|---|---|---|---|
| Global building energy demand | Buildings account for approximately 30% of global final energy consumption. | Global final energy, 2022 | Compare monthly site energy consumption against a weather-normalized 2025 baseline. | Reduce total energy use by 5–10% | IEA, 2023 |
| Building-related emissions | Building operations contribute approximately 26% of global energy-related emissions. | Global energy-related CO₂ emissions, 2022 | Track electricity, fuel, refrigerants, and purchased heat separately, using consistent emission factors. | Reduce operational emissions in line with energy savings | IEA, 2023 |
| Building electricity demand | Buildings consume approximately 50% of global electricity, including residential and commercial buildings. | Global electricity consumption, approximately 2022 | Install submetering for HVAC, lighting, plug loads, data rooms, and common areas. | Identify the top three electricity loads | IEA, 2023 |
| Space cooling | Space cooling represents roughly 10% of global electricity consumption. | Global electricity, approximate share | Measure cooling energy by zone and review schedules, setpoints, filters, controls, and equipment efficiency. | Reduce cooling energy by 5–15% | IEA, The Future of Cooling |
| Heating and hot-water demand | Heating and hot water are among the largest energy uses in buildings, particularly in colder climates. | End-use category; varies by climate and building type | Track fuel and thermal energy separately; inspect boiler efficiency, insulation, controls, and hot-water losses. | Reduce heating and hot-water demand by 5–10% | IEA, Buildings sector analysis |
| Energy performance intensity | Energy intensity must be normalized because floor area, occupancy, operating hours, and climate differ between buildings. | kWh per m² per year, adjusted where possible | Calculate energy use intensity using utility bills, verified floor area, occupancy, operating hours, and local weather data. | Establish a verified 2025 EUI baseline | ISO 50001; ENERGY STAR Portfolio Manager methodology |
| Operational controls | Poor scheduling, simultaneous heating and cooling, and incorrect setpoints are common sources of avoidable consumption. | Operational performance | Conduct monthly checks of schedules, sensors, alarms, setpoints, dampers, and equipment sequencing. | Complete 12 monthly control reviews | ISO 50001 energy-management principles |
| Renewable electricity | Renewables supplied approximately 30% of global electricity generation in 2023, while building-level coverage varies significantly by location. | Global electricity generation, 2023 | Report on-site generation, purchased renewable electricity, storage, and grid electricity as separate sources. | Increase renewable electricity where technically and financially viable | IEA, Global Energy Review 2024 |
| Data quality and accountability | A reliable baseline requires complete utility data, consistent boundaries, documented assumptions, and regular verification. | Site-level measurement quality | Create a monthly dashboard covering consumption, cost, emissions, EUI, anomalies, and corrective actions. | Report performance every month | ISO 50001; GHG Protocol |
Related Posts
-
Top 10 Energy Sources You Should Know for a Sustainable Future
-

Best Ways to Find Energy in Your Daily Life?
-
Why Choose Green Energy Solutions for a Sustainable Future?
-
How to Find Energy Efficient Suppliers for Your Business?
-

How to Improve Energy Efficiency in Your Home and Reduce Utility Bills
-
Top 10 Best Innovations in the Energy Industry Today?